Power BI
Bring your data to life with Power BI.
Empower your team to make data-driven decisions fast with Power BI. As one of the most powerful business intelligence platforms, Power BI allows you to create interactive data visualisations tailored to your organisation and industry.
Why Power BI?
A suite of business analytics tools, Power BI takes business intelligence to the next level. With Power BI, you can easily connect to your data sources, visualise and discover what’s important, and share the data with anyone in your organisation.
Create personalised dashboards – Through a simple drag and drop system, create customised, visual dashboards, exactly how you want them in minutes.
A fast and secure solution – As Power BI is cloud based, there are no memory or speed constraints, so you can quickly retrieve and analyse your data securely.

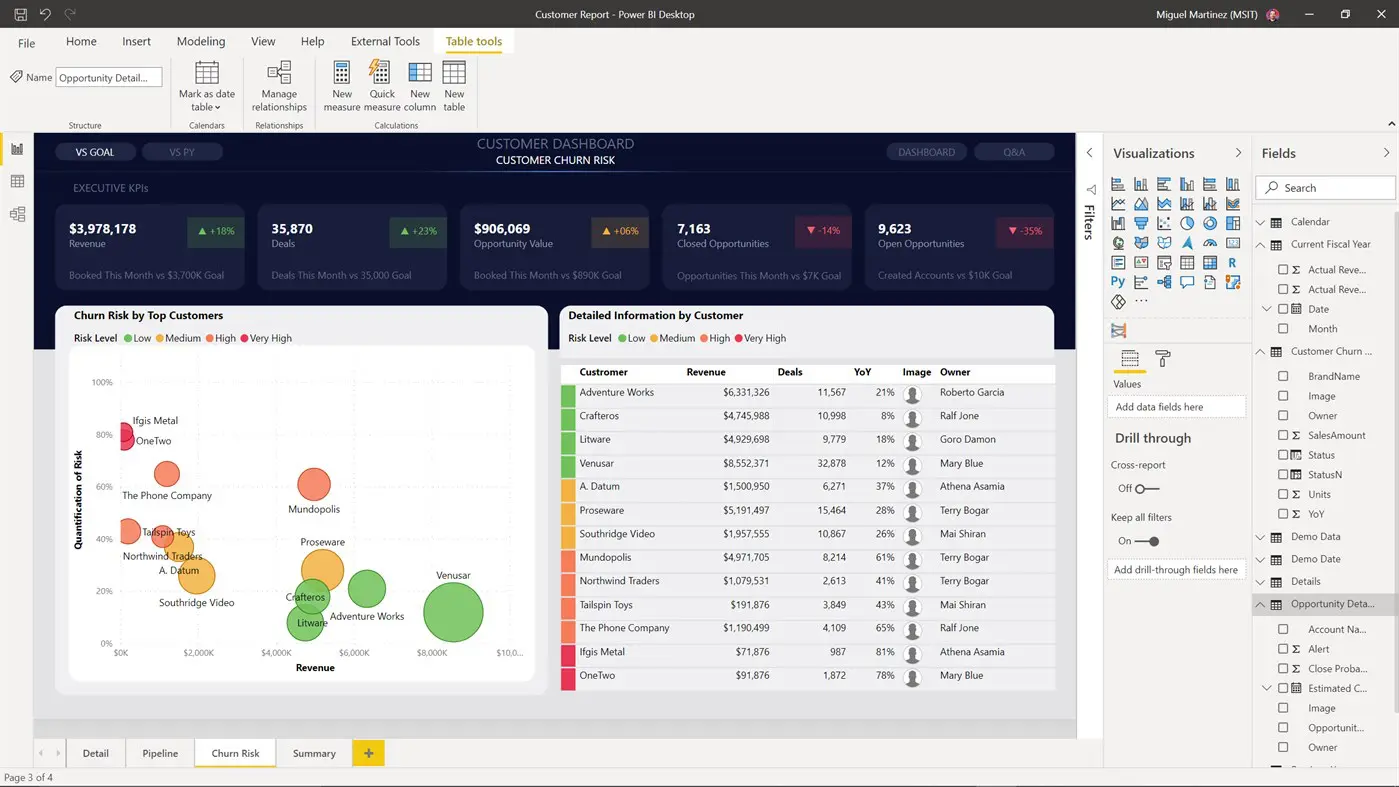
Get your data in real-time – Automatic data refresh means that you are always working from real-time data, accessible from any device, anywhere in the world.
Seamless integration with your existing analytics – Our team of Power BI experts will ensure your existing analytics and reporting tools are integrated seamlessly, allowing you to embed interactive visuals into your business easily.
How Power BI works
Offering data preparation and discovery, interactive dashboards and rich visualisation’s in one solution, Power BI is the ideal tool for your business intelligence. Here is how it works in Power BI:
Data collection and transformation from multiple sources – Business intelligence tools like Power BI use the extract, transform, and load (ETL) method to aggregate structured and unstructured data from multiple sources. This data is then transformed and remodeled before being stored in a central location. Applications can then easily analyse and query it as one comprehensive data set.
Uncover trends and inconsistencies – Data mining, or data discovery, uses automation to analyse data to find patterns and inconsistencies. These then provide insight into the current state of business. BI tools often feature several types of data modeling and analytics—including exploratory, descriptive, statistical, and predictive—that further explore data, predict trends, and make recommendations.
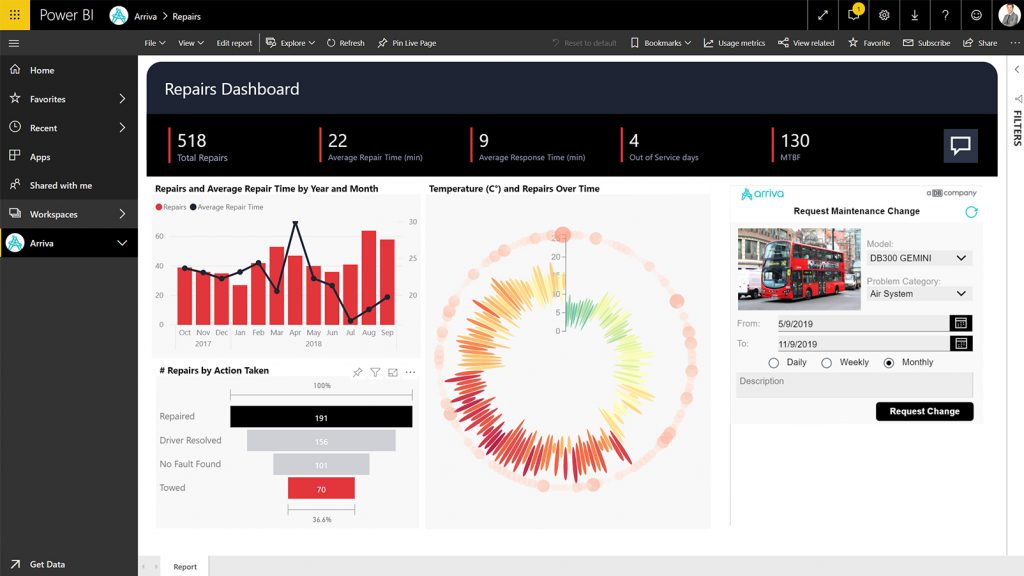
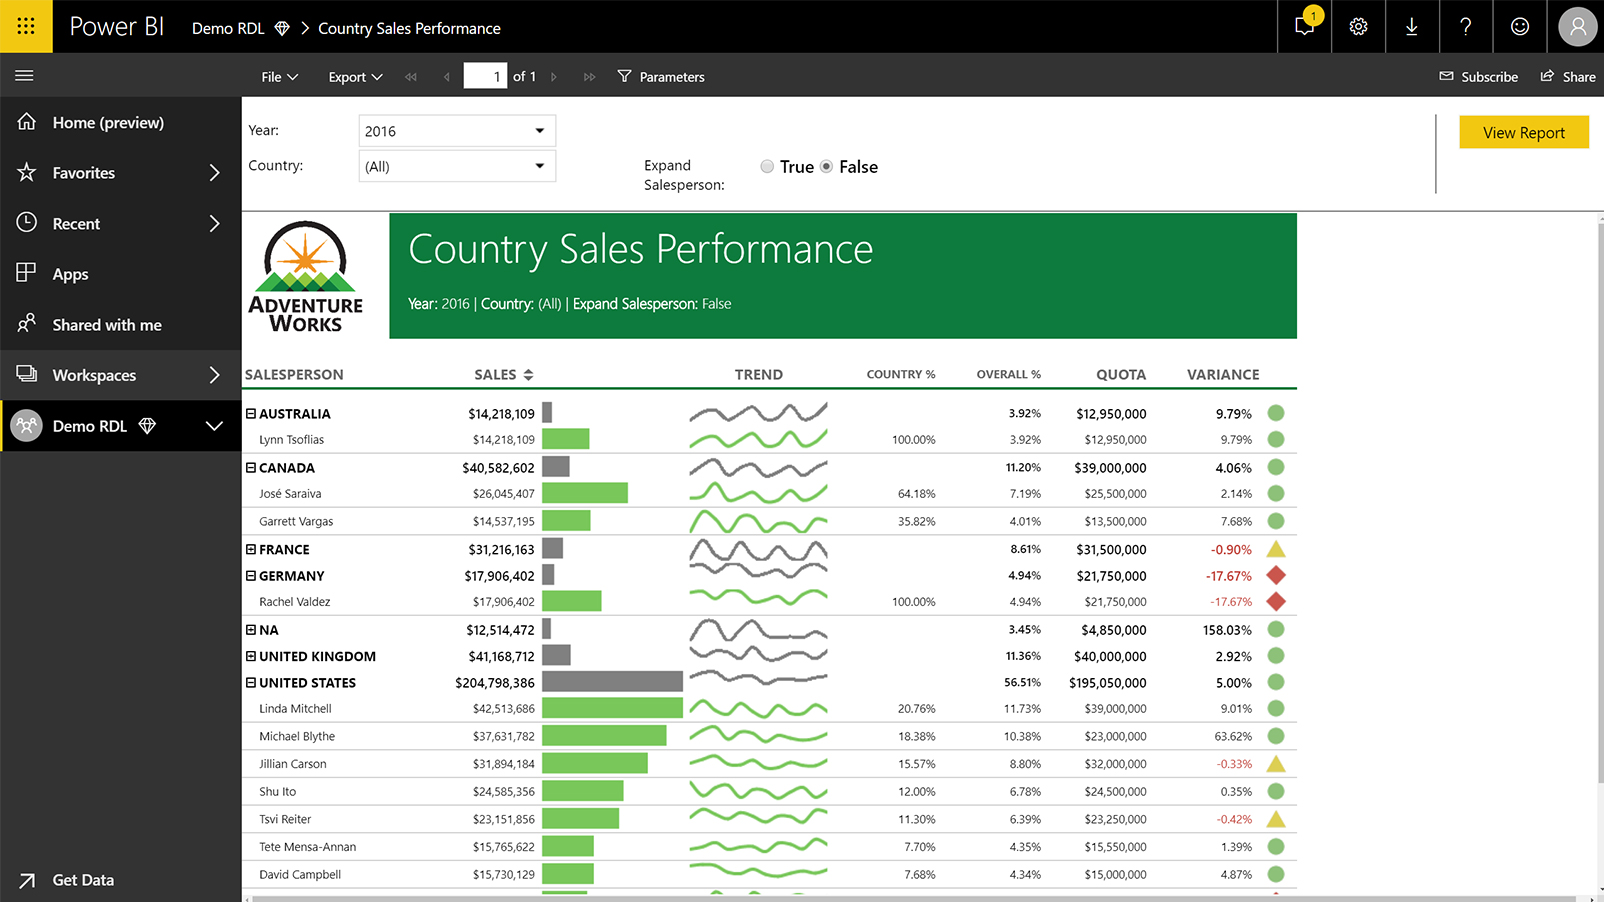
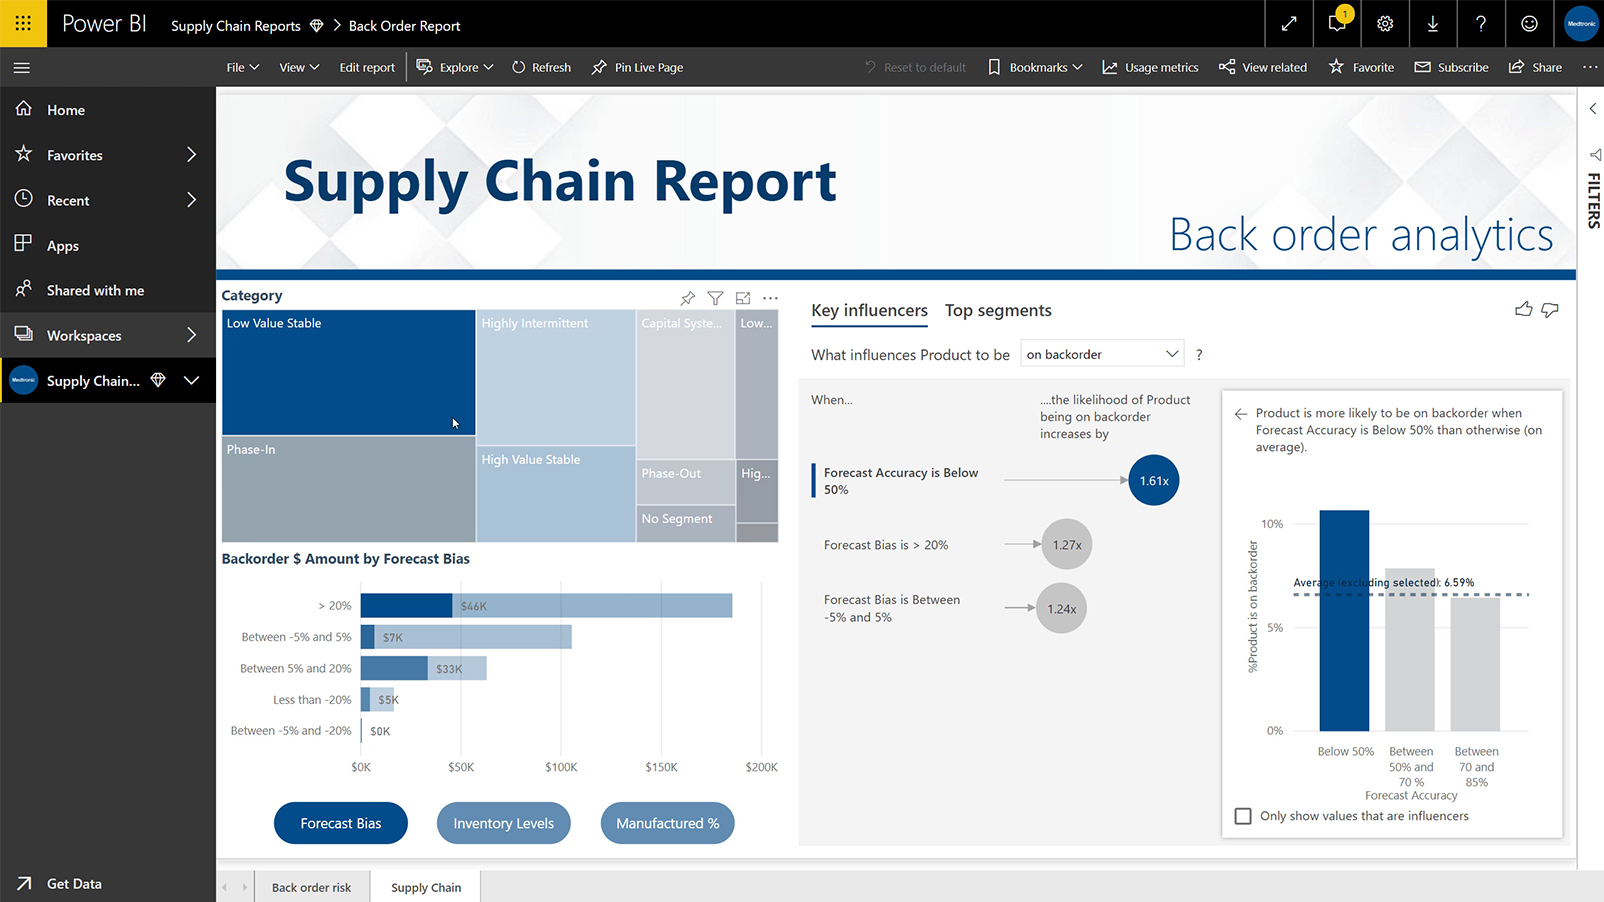
Reporting – With your data collated, Power BI then makes it incredibly easy to bring everything together into one place. From comprehensive dashboards to sales and supply chain reports, you have greater visibility in your reporting efforts.
Microsoft Fabric
Power BI is now part of Microsoft Fabric a new unified data platform from Microsoft. Fabric brings together all the data and analytics tools that organisations need to unlock the potential of their data and lay the foundation for the era of AI.
Microsoft Fabric integrates technologies like Azure Data Factory, Azure Synapse Analytics, and Power BI into a single unified product, empowering data and business professionals alike to get the most out of their data. Microsoft Fabric, like Power BI, uses low-code capability to help make better data platform approaches accessible to more users.
Power BI services
If you’re looking to start your journey with Power BI, we can help. Bridgeall is a leading Microsoft Gold Partner that provides a range of services to support your journey with Power BI. We have a specialist team of Microsoft certified consultants and developers who will work with your organisation and align your business intelligence to your business objectives.
We are Microsoft Gold Certified for Data Platform and Data Analytics and provide a full range of advice, implementation, licensing, training and support services for your business.
Our Power BI briefing is designed to provide you with a complete overview of the capability available. Whether you are exploring your options or want to get started, we will discuss your individual requirements to ensure the best solution to meet your needs.
Power BI Quickstart
We offer a packaged consultancy, governance and strategy called Power BI Quickstart. During Quickstart we will help you get up and running with Power BI or review your existing set up to ensure you are doing things right. We provide a governance strategy, best practise advise and a roll out plan in your organisation.
We offer a range of training services to empower your users to make the most of Power BI, build dashboards and understand your data.
Our Power BI training will give you hands-on practical experience led by our expert Bridgeall consultants. The training is designed to accelerate your Power BI experience and teach you how to analyse your data in a rich and compelling way.

